Tuesday, June 21, 2005
Trick 1: Reconciliation
Quite often there is a need to do quick reconcilliations between two different systems.
Take a simple example. You are converting from system A to system B and need to make sure all the items are loaded into system B, and that a calculated value agrees.
How does one do this in Excel?
First we need to load the data into Excel. This can be done in various ways, but ADODB is probably the best.
The data needs to be loaded in a certain form, and this diagram illustrates what is required.
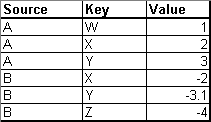
The first column contains the name of the source system. The second column contains the key we need to use to match. The last column contains the calculated value. We load up all the rows from system A, then append the rows from system B.
When we load the calculated value from the second system, we negate the number. More on this later.
Now we can proceed to phase two. We select all the data, and then build a pivot table from the results. The source goes in the column headers. The key goes in the row, and the calculated value goes in the data area.
The pivot table will now look like this.
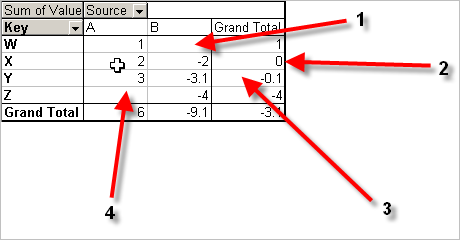
So what do we have. Anything with a blank in the A or B column means a missing or extra item. When there are two items, but a non zero grand total for the row, this grand total shows the difference.
1. There is a blank in the B column. That means an item in system A doesn't exist in system B
2. We have an item in both, and a zero grand total. That means a perfect match.
3. We have an item in both, but the values are different. 3 and 3.1 or a difference of 0.1
4. A blank in column A means an item in system B exists, where as it doesn't exists in system A
Its as quick as that.
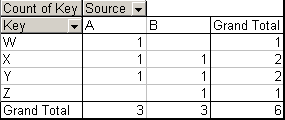
This shows what happens if you put the key or source in the data area. Normally a key would be a string, so it won't sum the data, it counts it. Here we can quickly see anything with a 1 in the data illustrates a missing value. The grand totals of the columns show the number of items from each source.
If you were doing this as part of a conversion, it pays to automate the process. For example, you could build some macros that download all the data, then build the pivot table.
Once the pivot table is built, you can write a macro that hides the good data, just displaying the bad or vice versa.
If you do this, another enhancement is to add on a name to sign off the differences. Then all you need to do as part of a big bang conversion is to run the reconciliation, filter the good items out. That then needs to be signed off by the business, and filed.
This is probably the best Excel trick I have come across. Its not obvious at all that Excel can do things like this without doing a lot of work.
Thanks Dom!
Take a simple example. You are converting from system A to system B and need to make sure all the items are loaded into system B, and that a calculated value agrees.
How does one do this in Excel?
First we need to load the data into Excel. This can be done in various ways, but ADODB is probably the best.
The data needs to be loaded in a certain form, and this diagram illustrates what is required.
The first column contains the name of the source system. The second column contains the key we need to use to match. The last column contains the calculated value. We load up all the rows from system A, then append the rows from system B.
When we load the calculated value from the second system, we negate the number. More on this later.
Now we can proceed to phase two. We select all the data, and then build a pivot table from the results. The source goes in the column headers. The key goes in the row, and the calculated value goes in the data area.
The pivot table will now look like this.
So what do we have. Anything with a blank in the A or B column means a missing or extra item. When there are two items, but a non zero grand total for the row, this grand total shows the difference.
1. There is a blank in the B column. That means an item in system A doesn't exist in system B
2. We have an item in both, and a zero grand total. That means a perfect match.
3. We have an item in both, but the values are different. 3 and 3.1 or a difference of 0.1
4. A blank in column A means an item in system B exists, where as it doesn't exists in system A
Its as quick as that.
This shows what happens if you put the key or source in the data area. Normally a key would be a string, so it won't sum the data, it counts it. Here we can quickly see anything with a 1 in the data illustrates a missing value. The grand totals of the columns show the number of items from each source.
If you were doing this as part of a conversion, it pays to automate the process. For example, you could build some macros that download all the data, then build the pivot table.
Once the pivot table is built, you can write a macro that hides the good data, just displaying the bad or vice versa.
If you do this, another enhancement is to add on a name to sign off the differences. Then all you need to do as part of a big bang conversion is to run the reconciliation, filter the good items out. That then needs to be signed off by the business, and filed.
This is probably the best Excel trick I have come across. Its not obvious at all that Excel can do things like this without doing a lot of work.
Thanks Dom!
![]()
Subscribe to Posts [Atom]